How to Measure Valley's ROI and Performance

Try Valley
Make LinkedIn your Greatest Revenue Channel ↓

Saniya Sood
How to Calculate Valley's Return on Investment?
Understanding Valley's financial return requires tracking costs, attributing revenue, and measuring efficiency gains across multiple dimensions. ROI calculation isn't just about justifying current investment; it informs scaling decisions and budget allocation.
Direct Cost Components:
Valley subscription: $347-$10,200 monthly depending on seats ($4,164-$122,400 annually)
Sales Navigator (recommended): $99/seat monthly ($1,188/seat annually)
Implementation time: 10-15 hours one-time setup (≈$1,500-$2,000 in opportunity cost)
Ongoing management: 2-3 hours weekly per seat (≈$200-$300 monthly in time cost)
Total First-Year Cost:
Single seat: $4,164 (Valley) + $1,188 (Sales Nav) + $2,000 (setup) + $3,000 (management) = $10,352
Three seats: $10,188 (Valley) + $3,564 (Sales Nav) + $4,000 (setup) + $9,000 (management) = $26,752
Ten seats: $30,000 (Valley Scale minimum) + $11,880 (Sales Nav) + $8,000 (setup) + $30,000 (management) = $79,880
Revenue Attribution:
First-touch attribution (Valley sourced the lead): Pipeline from profile viewer campaigns, Pipeline from post engagement campaigns, Pipeline from website visitor campaigns, Pipeline from competitor engagement campaigns.
Total first-touch pipeline: $X
Multi-touch attribution (Valley influenced but didn't source): Existing leads advanced through Valley engagement, Dormant opportunities re-engaged, Buying committee expansion at active accounts.
Total influenced pipeline: $Y
ROI Calculation Formula:
ROI = ((Revenue from Valley − Cost of Valley) ÷ Cost of Valley) × 100
Example 1: Single Seat, 90-Day Results
Cost: $2,588 (3 months Valley + Sales Nav + prorated setup) Pipeline generated: $85,000 Assumed 30% win rate: $25,500 revenue ROI: (($25,500 − $2,588) ÷ $2,588) × 100 = 885% ROI
Example 2: Three Seats, 12-Month Results
Cost: $26,752 annually Pipeline generated: $420,000 Assumed 30% win rate: $126,000 revenue ROI: (($126,000 − $26,752) ÷ $26,752) × 100 = 371% ROI
Example 3: Ten Seats, 12-Month Results
Cost: $79,880 annually Pipeline generated: $1,800,000 Assumed 30% win rate: $540,000 revenue ROI: (($540,000 − $79,880) ÷ $79,880) × 100 = 576% ROI
These calculations assume conservative 30% win rates. Actual results vary by industry and sales effectiveness.
► Book a demo and explore how Valley can support your use case

What Metrics Should You Track to Measure Valley Performance?
Comprehensive Valley measurement requires tracking metrics across activity, engagement, pipeline, and revenue.
Activity Metrics (Input Measures):
Prospects contacted monthly: How many qualified prospects received outreach?
Benchmark: 100-200 per seat monthly
Signals captured: Profile views, post engagers, website visitors, etc.
Benchmark: 150-300 signals per seat monthly
Message approval rate: Percentage of AI-generated messages approved without editing
Benchmark: 80%+ after 30-day training
Campaign velocity: How quickly prospects move through sequences?
Benchmark: First message within 24 hours of signal capture
Engagement Metrics (Response Measures):
Connection acceptance rate: Percentage of connection requests accepted
Benchmark: 30-40%
Response rate: Percentage of messaged prospects who reply
Benchmark: 6-10% overall, 25-35% positive among responders
Reply quality: Positive vs. neutral vs. negative sentiment
Benchmark: 60%+ positive among replies
Conversation depth: Multi-message exchanges vs. single replies
Benchmark: 40%+ multi-message threads
Conversion Metrics (Pipeline Measures):
Meeting booking rate: Percentage of prospects who schedule meetings
Benchmark: 2-4% of all contacted, 25-35% of positive responders
Qualified opportunity rate: Percentage of meetings that become real opportunities
Benchmark: 60-70%
Pipeline value per prospect: Average pipeline generated per contacted prospect
Benchmark: $1,000-$2,000 per prospect at $25,000 average deal size
Time to meeting: Days from first contact to scheduled meeting
Benchmark: 7-14 days
Revenue Metrics (Outcome Measures):
Pipeline generated: Total dollar value of opportunities sourced by Valley
Benchmark: $60,000-$100,000 per seat monthly
Win rate: Percentage of Valley-sourced opportunities that close
Benchmark: 25-35% (may exceed other channels due to warm introduction)
Revenue per seat: Closed revenue attributable to each Valley seat
Benchmark: $180,000-$360,000 annually per seat
Customer acquisition cost: Total Valley cost ÷ customers acquired
Benchmark: 50-70% lower than cold outbound
Efficiency Metrics (Resource Utilization):
Time saved on research: Hours per week not spent on manual prospecting
Benchmark: 15+ hours per seat weekly
Cost per qualified meeting: Valley cost ÷ meetings booked
Benchmark: $50-$100 (vs. $200-$400 for cold methods)
Outreach capacity: Prospects contacted per hour of human effort
Benchmark: 50-100 prospects per hour with Valley vs. 2-3 manually
Rep productivity: Pipeline per rep vs. previous methods
Benchmark: 2-3x improvement
How to Set Up Proper Attribution for Valley's Pipeline Contribution?
Attribution determines which marketing and sales activities receive credit for pipeline and revenue. Proper Valley attribution ensures its impact is visible and valued.
First-Touch Attribution Model:
Valley gets credit when it generated the initial contact with a prospect who had no prior relationship with your company.
Qualifying criteria: Prospect discovered through Valley signal (not on prior target lists), First conversation initiated through Valley outreach, No prior inbound activity from prospect, No prior sales outreach attempts.
Last-Touch Attribution Model:
Valley gets credit when it drove the final action before opportunity creation.
Qualifying criteria: Prospect was known but dormant, Valley re-engagement triggered response, Meeting booked through Valley sequence, Opportunity created from Valley conversation.
Multi-Touch Attribution Model:
Valley receives partial credit alongside other touchpoints.
Example journey: Prospect attended webinar (Inbound gets 25% credit), Prospect visited website (Website gets 25% credit), Prospect viewed profile (Valley gets 25% credit), Sales rep called (Sales gets 25% credit).
Valley's contribution is recognized without claiming full credit.
Position-Based (U-Shaped) Attribution:
First and last touches get more credit than middle touches.
Example: Prospect engaged with LinkedIn post (Valley: 40%), Visited website twice (Website: 10%), Downloaded case study (Content: 10%), Booked meeting through Valley (Valley: 40%).
Valley receives 80% total credit for bookend contributions.
Time-Decay Attribution:
More recent touches receive higher credit.
If prospect engaged with Valley 90 days ago then recently again, recent engagement gets majority credit recognizing recency impact.
Implementation in CRM:
Tag all Valley-sourced contacts with "Valley" campaign attribution, Create Valley-specific opportunity source category, Use opportunity fields to track: First touch source (Valley vs. other), Last touch source, All touches in prospect journey, Pipeline velocity by source.
Generate reports filtering by Valley attribution to measure contribution.
How to Track Valley Performance Over Time and Identify Trends?
Point-in-time metrics provide snapshots. Trend analysis reveals whether performance is improving, declining, or stable—informing strategic adjustments.
Month-Over-Month Trend Tracking:
Create dashboards showing: Response rates by month (improving or declining?), Meeting volume by month (growing or shrinking?), Pipeline generation trends (accelerating or flattening?), Message quality scores over time (AI learning or degrading?).
Expected Trend Patterns:
Months 1-2: Ramping performance as AI trains and team learns, Response rates 50-70% of steady-state, Meeting volume below target.
Months 3-6: Approaching steady-state performance, Response rates stabilizing, Meeting volume hitting targets, Some volatility as team optimizes.
Months 7+: Mature performance with consistent results, Continuous improvement from ongoing optimization, Seasonal variations become visible.
Trend Analysis Questions:
Declining response rates: Has ICP definition drifted too broad?, Is message personalization degrading?, Are we exhausting our addressable market?, Has LinkedIn changed policies affecting delivery?
Declining meeting bookings: Are qualification criteria too loose?, Is response management slow (prospects cooling off?), Are calendars not optimized?, Have win rates changed for a reason?
Stagnant pipeline: Has market cooled for our category?, Are we targeting wrong segments?, Is competition intensifying?, Should we adjust value proposition?
Cohort Analysis:
Track prospects by signup month cohort: January prospects: X% response rate, Y% meeting rate, $Z pipeline, February prospects: Compare to January, March prospects: Compare to February.
Cohort analysis reveals whether recent changes improved or hurt performance.
A/B Test Tracking:
When testing messaging, signals, or approaches: Track control group performance, Track test group performance, Calculate statistical significance, Implement winners, iterate losers.
Continuous testing drives incremental performance improvements.
► Check Out More of Valley's Incredible Outreach: A compilation of real time messages and responses!

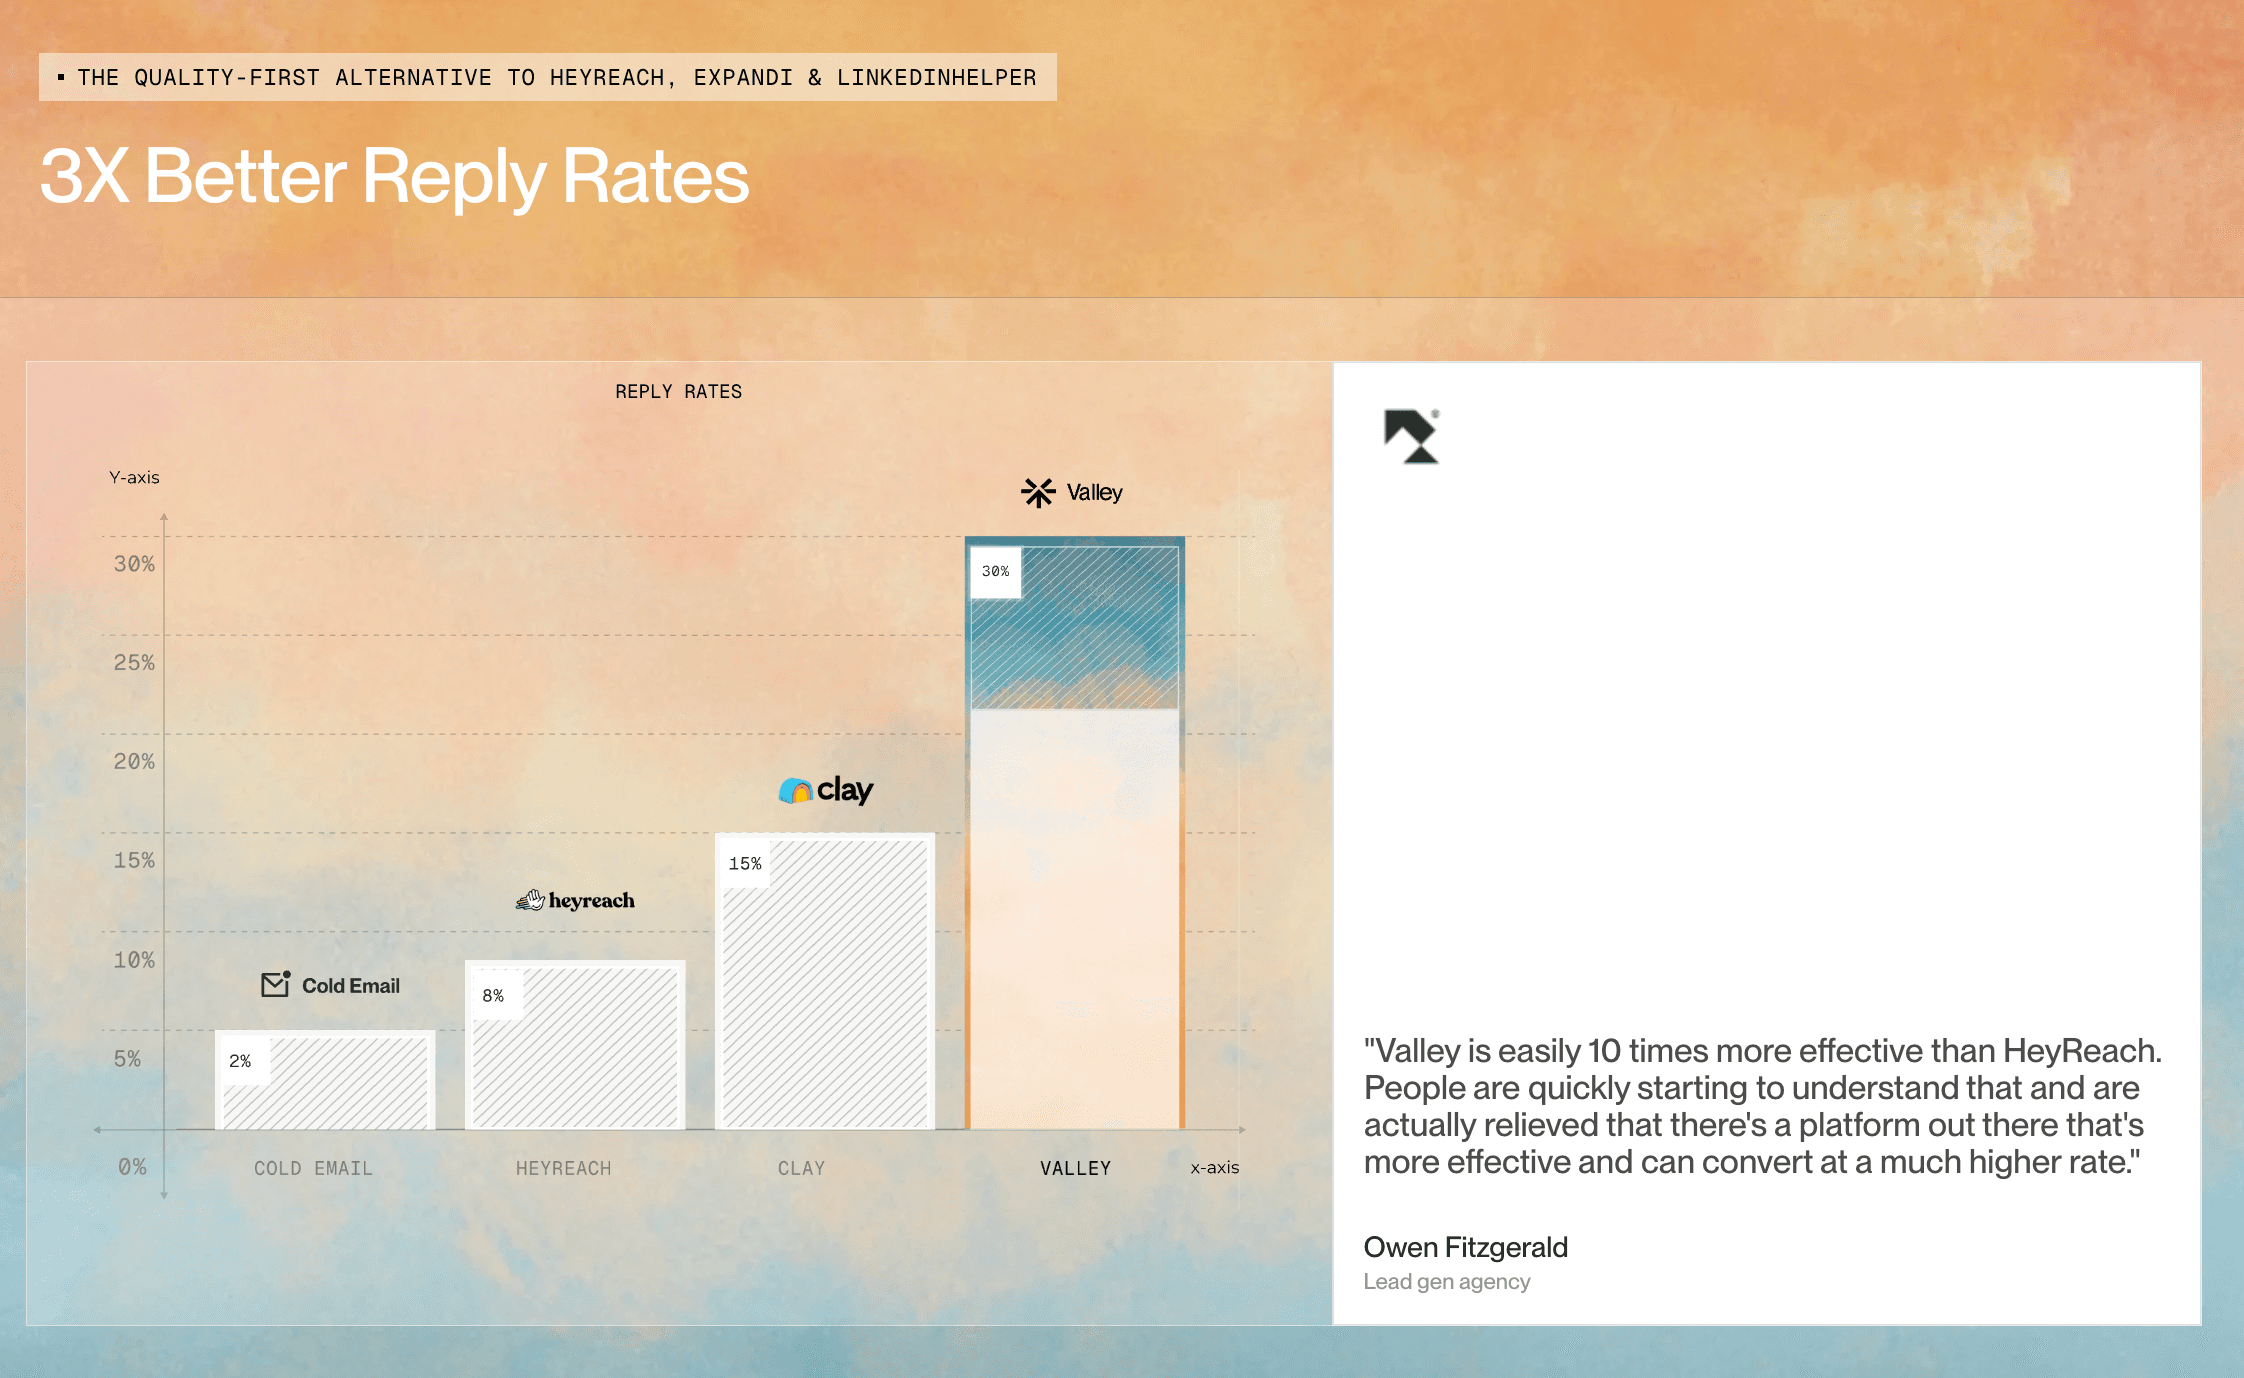
How Does Valley Performance Compare to Other Outbound Channels?
Understanding Valley's performance relative to alternatives (cold email, cold calling, paid ads) justifies channel investment.
Valley vs. Cold Email:
Response rates: Valley 6-10% vs. Cold Email 1-2% (3-5x advantage)
Meeting conversion: Valley 25-35% of responders vs. Email 15-20% (1.5-2x)
Deliverability: Valley 100% (LinkedIn native) vs. Email 70-85% (spam filters)
Cost per meeting: Valley $50-$100 vs. Email $80-$150
Speed to meeting: Valley 7-14 days vs. Email 14-30 days
Verdict: Valley significantly outperforms cold email on most metrics.
Valley vs. Cold Calling:
Response rates: Valley 6-10% vs. Calling 2-5% (2-3x advantage)
Meeting conversion: Valley 25-35% vs. Calling 20-30% (comparable)
Scalability: Valley 100-200 contacts/seat/month vs. Calling 50-100 (2x)
Cost per meeting: Valley $50-$100 vs. Calling $100-$200
Rep time investment: Valley 10 hours vs. Calling 40 hours (4x efficiency)
Verdict: Valley more scalable and efficient; calling still valuable for high-touch scenarios.
Valley vs. Paid LinkedIn Ads:
Cost per lead: Valley $20-$40 vs. Ads $50-$150 (2-4x cheaper)
Lead quality: Valley higher (warm signals) vs. Ads variable (cold clicks)
Targeting precision: Valley behavioral vs. Ads demographic
Scalability: Valley limited by signal volume vs. Ads limited by budget
Control: Valley direct outreach vs. Ads requires compelling offer
Verdict: Valley better for targeted, relationship-based selling; Ads better for awareness and volume.
Valley vs. Inbound Marketing:
Cost per lead: Valley $20-$40 vs. Inbound $50-$200 (depends on content investment)
Lead quality: Valley high (qualified signals) vs. Inbound variable (tire-kickers common)
Predictability: Valley controllable vs. Inbound dependent on algorithm/SEO
Speed to results: Valley 30-60 days vs. Inbound 6-12 months
Scalability: Valley limited by addressable market vs. Inbound theoretically unlimited
Verdict: Valley provides faster, more predictable results; Inbound builds long-term asset.
Optimal Channel Mix:
Most successful teams don't choose one channel exclusively: Valley for warm LinkedIn outbound (30-40% of pipeline), Inbound for content-driven leads (25-35%), Cold email for high-volume testing (15-20%), Calling for high-value accounts (10-15%), Paid ads for awareness and volume (5-10%).
Valley should be core channel given efficiency and results, not the only channel.
► Here's the Valley Warm Outbound Launch Video

Related Blogs

FEATURED READ
5 min
Best Waalaxy Alternatives 2026
Read
Read

FEATURED READ
5 min
Best HeyReach & Waalaxy Alternative for Agencies
Read
Read

FEATURED READ
5 min
0 to $1M ARR With Zero Ads: The Three Systems That Built the Pipeline
Read
Read

FEATURED READ
5 min
LinkedIn Automation Tool for Agencies: Client Accounts
Read
Read
Which channels does Valley support?
Valley supports LinkedIn outreach, including connection requests and InMails. Valley users safely send 1000-1200 messages per seat every month.
How safe is it and does Valley risk my LinkedIn account?
Do I have to commit to an Annual Plan like other AI SDRs?
How does Valley personalize messages?

VALLEY MAGIC


